The potential of spectroscopy in the diagnosis of hepatocellular carcinoma – a pilot study
Petr Hříbek1, Lucie Habartová2, Kristýna Kubíčková1, Johana Klasová1, Vladimír Setnička2, Petr Urbánek1
+ Affiliation
Summary
None of the biomarkers studied so far in the HCC area has yielded higher sensitivity and specificity in the early-stage diagnosis than the liver ultrasonography examination. There is an urgent clinical need for establishing a laboratory marker for HCC that meets the requirements for high sensitivity and specificity for the screening and early diagnosis of at-risk patients. As a variety of pathological processes, including carcinogenesis, may cause changes in both the concentration and the structure and spatial arrangement of body biomolecules, the spectroscopic analysis of blood-based derivatives appears to be an appropriate tool for the early detection thereof. In our research, the focus is on the identification of novel biomarkers in blood plasma, which would exhibit sufficient sensitivity and specificity to detect early and potentially curable HCC stages, and which would be potentially useful for routine screening of this disease in well-defined at-risk groups. For this purpose, we utilised a unique combination of two chiroptical methods – electronic circular dichroism (ECD) and Raman optical activity (ROA) – supplemented by non-polarised variants – infrared (IR) absorption and Raman spectroscopy. Methods: Blood plasma of 18 selected patients with liver cirrhosis, 8 of which also suffered from HCC, was analysed by a combination of ECD, ROA, IR and Raman spectroscopy. Results: The obtained spectral data were processed by a multivariate statistical evaluation using principal component analysis (PCA) and linear discriminant analysis (LDA). The visualisation of the LDA results showed the separation of the two monitored groups with only a slight overlap. Based on the spectral analysis within this preliminary study, sensitivity and specificity for the discrimination between cirrhotic individuals with and without HCC reached 88% and 90% after leave-one-out cross validation, respectively. The area under the ROC curve of 0.975 proved high reliability of the established model. Conclusion: Based on our findings, the combination of advanced spectroscopic methods for the analysis of blood plasma might be a promising tool in HCC diagnosis and potentially in the screening thereof.
Keywords
hepatocellular carcinoma, blood plasma, spectroscopy, cirrhosis
Introduction
Hepatocellular carcinoma (HCC) is the most common primary malignant neoplasm of the liver [1]. HCC develops in the vast majority of cases in the background of pre-existing liver disease at the stage of liver cirrhosis. Exceptions to this rule include chronic hepatitis B (HBV) infection and non-alcoholic steatohepatitis (NASH), where HCC can develop in the pre-cirrhosis stages. HCC in patients without chronic liver disease is rare. In the Czech Republic, according to the latest data from the Institute of Health Information and Statistics (ÚZIS), the incidence of HCC is 9.0 cases/100,000 inhabitants/year [2]. HCC will develop in approximately one- -third of patients with liver cirrhosis during their life. Patients with HCC in the background of liver cirrhosis are classified according to the Barcelona Clinic Liver Cancer (BCLC) classification in order to stage the disease and determine the therapy according to this staging. HCC is a malignancy with a highly unfavourable prognosis. The overall 5-year survival rate across stages reaches 12% [3]. In contrast, patients with early diagnosed HCC can be treated curatively and have excellent survival rates. In patients for whom radical surgical treatment, such as resection or transplantation, is possible according to staging, the 5-year overall survival rate exceeds 80% [4,5]. It is clear from the above that the early diagnosis of HCC is crucial. The application of surveillance is possible in patients with identified high-risk disease. Currently, HCC surveillance relies on liver ultrasonography (USG) at 6-month intervals; this methodology has been recommended by the American Association for the Study of Liver Diseases (AASLD) and the European Association for the Study of the Liver (EASL) [6,7]. USG is a very convenient method because of its relatively low cost and zero patient burden. The disadvantages include high demands on the experience of the examiner – the so-called expert-dependent method – and the difficulty or impossibility of a valid examination in obese patients. For these reasons, the sensitivity of USG in identifying early and thus curable stages of HCC is reported to be only around 60% [8]. Alpha-fetoprotein (AFP), which is referred to as a tumour marker for HCC, does not provide the desired sensitivity to justify its use for screening and the search for patients with early HCC. In our experience, approximately only one third of HCC patients across stages show a significant elevation of AFP, and even of these, only a small proportion show a specific elevation (cut-off 400 ng/mL) [9]. Given these facts, there is an urgent need to identify an objective biomarker easily obtainable from peripheral blood of at-risk patients that would meet the requirements of adequate sensitivity and specificity for the early diagnosis of HCC. The process of carcinogenesis may lead to changes in not only the concentration, but also the structure of biomolecules that can be detected by spectroscopic analysis of blood plasma [10]. As a part of research projects on early diagnosis of cancer and degenerative diseases, a team at the Department of Analytical Chemistry of the University of Chemistry and Technology Prague (UCT) developed a unique methodology for the spectrosopic analysis of blood plasma using a combination of conventional infrared (IR) and Raman spectroscopy and advanced spectroscopic methods – electronic circular dichroism (ECD) and Raman optical activity (ROA) [11–13]. This unique approach has already provided promising results in the identification of spectral markers of pancreatic cancer [14] and colorectal cancer [15]; therefore, there is also an opportunity to use this methodology to study HCC as another gastrointestinal malignancy. Our hypothesis was that a combination of spectroscopic methods of blood plasma analysis would identify biomarkers of liver carcinogenesis with sufficient sensitivity and specificity to distinguish HCC and non-HCC patients with liver cirrhosis. Considering the USG results, the minimum acceptable sensitivity and specificity were set to 65% and 75%, respectively.
Patient cohort and methodology
Eighteen patients with liver cirrhosis, 8 of them with HCC, were enrolled into the study. Seven subjects with HCC had intermediate stage according to the BCLC classification, 1 subject was classified with the advanced stage. The cohort consisted of 13 males. Median of age of whole cohort was 68.5 years at the time of diagnosis.
The subjects were included in the study according to inclusion/exclusion criteria after signing the informed consent form.
Inclusion criteria for HCC patients:
a) age 18–80 years and signed informed consent form,
b) liver cirrhosis as determined by histology and/or non-invasive measurement of liver stiffness and/or evidence of a history of decompensated liver cirrhosis,
c) HCC diagnosed in accordance with EASL recommended procedures.
Inclusion criteria for non-HCC patients:
a) age 18–80 years and signed informed consent form,
b) liver cirrhosis as determined by histology and/or non-invasive measurement of liver stiffness and/or evidence of a history of decompensated liver cirrhosis,
c) absence of a lesion in baseline USG and at least 2 negative USG examinations during follow-up at 6-month intervals.
Exclusion criteria:
a) severe polymorbidity (advanced heart failure, chronic renal insufficiency grade 4 or higher, long-term unsatisfactorily compensated diabetes mellitus with complications),
b) absence of liver cirrhosis,
c) history of other malignancies,
d) pregnancy,
e) presumed non-compliance and/or failure to sign the informed consent form.
In enrolled subjects, baseline biochemistry, blood count and AFP level were examined simultaneously with the blood collection for the spectroscopic analysis. The subjects‘ blood was collected into tubes with an K3EDTA anticoagulant solution and centrifuged. Subsequently, the obtained plasma was transferred into Eppendorf tubes and immediately deep-frozen and stored at –80 °C until the spectroscopic analysis at UCT Prague. A unique combination of two chiroptical methods – ECD (J-815, Jasco, Japan) and ROA (ChiralRaman-2X, BioTools, Inc., USA), complemented by Raman (ChiralRaman-2X, BioTools, Inc., USA) and IR spectroscopy (Nicolet 6700, Thermo Fisher Scientific, USA) – was used for the analysis. Prior to the analysis, blood plasma samples were thawed at room temperature and filtered using a polyvinylidenedifluoride membrane, 0.45-μm pore size, at 13,000 × g for 10 min. For ECD, samples were diluted with sterile phosphate buffer of pH = 7.4 in 1: 3 volume ratio; for IR experiments, the filtered blood plasma was used without further treatment. In order to suppress the undesired fluorescence of blood plasma biomolecules during Raman and ROA measurements, a unique methodology developed at the UCT Prague [13], consisting of the addition of a fluorescence quencher (10 mg NaI per 100 μL of plasma) and illumination in a laser beam was used. To prevent degradation, the temperature of the sample was maintained at 15 °C during the preparatory and analytical phases.
Statistical processing of spectral data was performed by principal component analysis (PCA) in Unscrambler X (Camo, Norway), followed by linear discriminant analysis (LDA) using XLSTAT v. 2016 (Addinsoft, France).
Results
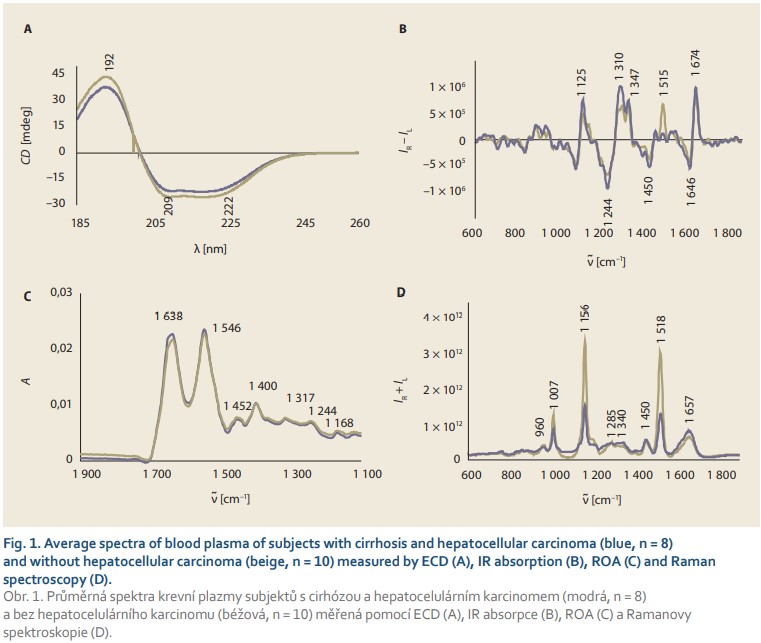
In the spectral analysis in the UV region, lower intensity of ECD spectra (Fig. 1A) was observed in HCC patients compared to subjects with cirrhosis without the tumour. The ECD spectrum in this region is sensitive to peptide/protein conformation. The 222 nm band reflects the presence of α-helical structures; thus, the slight differences in the relative intensities of 209/222 nm negative bands suggest a decrease in the amount of this conformation in blood plasma during HCC development.
Infrared spectroscopy also revealed a slight decrease in the intensity of all spectral bands (Fig. 1B) belonging to essential plasma biomolecules (1,638 and 1,546 cm–1 – proteins; 1,452 cm–1 – aliphatic side chains of proteins, phospholipids; 1,240–1,400 cm–1 – phospholipids, cholesterol, proteins). An interesting feature of the developing HCC is undoubtedly the change in the relative intensity of bands in the amide I (~1,638 cm–1) and amide II (~1,546 cm–1) regions, reflecting the vibrations of the protein peptide bond, where the ratio of these two bands reached 0.97 in non-HCC patients with cirrhosis, but it was reduced to 0.96 in HCC patients. Although such difference may appear negligible, it is a clear manifestation of the concentration changes of plasma proteins that occur during the disease. At the same time, variability in the shape of the ~1,638-cm–1 band was observed, namely its narrowing and the formation of a shoulder at 1,650 cm–1 in HCC patients, which again indicates the changing structure of plasma proteins due to carcinogenesis.
The average ROA and Raman spectra (Fig. 1C, D) also showed significant differences between HCC and non-HCC patients with cirrhosis. In both types of spectra, there were several bands with high signal-to-noise ratio in the so- -called amide I (~1,645–1,680 cm–1) and extended amide III (~1,230–1,350 cm–1) regions, reflecting the contribution of plasma proteins. The overall spectral pattern in these regions and the positions of the maxima of the observed bands are indicators of a predominant α-helical conformation with a contribution of ß-structures that increases slightly during HCC. In addition, changes were observed in the Raman bands at ~1,450 and ~960 cm–1 corresponding to aliphatic and carbohydrate/glycoprotein units, respectively. At the same time, we observed significant differences in the intensity of bands belonging to carotenoids (1,007; 1,156 and 1,518 cm–1) which, as antioxidants, protect the organism against oxidative stress that increases with carcinogenesis.
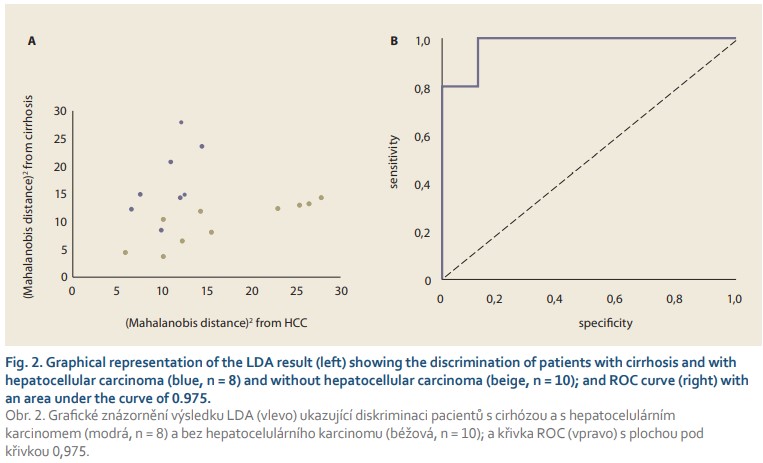
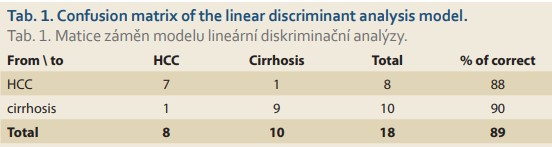
In order to reveal any differences in the acquired spectra, the acquired spectral data were evaluated by multivariate statistical analysis using PCA, the outputs of which served as input values for the subsequent linear discriminant analysis. The LDA (Fig. 2) results show a distribution of the two monitored groups with only a slight overlap. As can be seen from Tab. 1, the spectral analysis achieved discrimination of HCC and non-HCC patients with cirrhosis with a sensitivity and specificity of 88% and 90%, respectively, in cross-validation. Moreover, the area under the receiver operating characteristics (ROC) curve of 0.975 confirmed the high reliability of the proposed model. Although the number of samples studied is very limited, the results clearly indicate the ability of molecular spectroscopy to reliably detect specific manifestations of HCC at the molecular level.
Discussion
The presented results of a pilot study showed the possibility of using spectroscopic methods in the diagnosis of HCC in patients with liver cirrhosis. The combination of spectroscopic methods was able to distinguish patients with and without HCC at a very good level. A major shortcoming of the pilot project was the limited sample size, which only allowed to differentiate between tumour/non-tumour status and not the possibility of diagnosing HCC prior to the finding of imaging methods. However, the results were important as possible support for this concept, particularly for the degree of accuracy, with which the two groups were identified even in such a small cohort. By reviewing the international literature, the authors were able to find several studies utilizing spectroscopy in the diagnosis of HCC; however, the analyses were performed using tissue biopsy [16–19]. Although few studies have dealt with the non-invasive diagnosis of HCC using spectroscopic methods [20,21], none of them used the aforementioned combination of methods to differentiate the tumour/non-tumour status. One possible explanation is the general availability of comparable instrumentation at a single institution. Furthermore, the authors are aware of the limitations of examining only subjects with cirrhosis but this cohort seemed optimal for proof of concept purposes. Another reason for this choice was that patients with liver cirrhosis of any aetiology should be included in the application of HCC surveillance according to current recommendations and, therefore; the identification of a possible laboratory marker of hepatocarcinogenesis in these patients seems to be of utmost importance. The team of workers continue with the study and if the results of the pilot project are confirmed, further projects will follow with a focus on longitudinal follow-up of registered patients with cirrhosis and serial examinations to evaluate spectroscopic data at a time when the focal process is not yet detectable by imaging methods.
Conclusion
Spectroscopic analysis of blood plasma is a promising method for possible objectification of hepatocellular carcinoma diagnosis in patients with liver cirrhosis and may be used for early diagnosis. In our pilot study, we demonstrated the high reliability of this approach to differentiate patients with liver cirrhosis with and without the tumour.
Submitted/Doručeno: 8. 9. 2021
Accepted/Přijato: 1. 10. 2021
Petr Hříbek, MD
Department of Internal Medicine
1st Faculty of Medicine,
Charles University and ÚVN Prague
U Vojenské nemocnice 1200
169 02 Praha 6
petr.hribek@uvn.cz
To read this article in full, please register for free on this website.
Benefits for subscribers
Benefits for logged users
Literature
1. Ferlay J, J, Soerjomataram I, Dikshit R et al. Cancer incidence and mortality worldwide: sources, methods and major patterns in GLOBOCAN 2012. Int J Cancer 2015; 136(5): E359–E386. doi: 10.1002/ijc.29210.
2. UZIS aR. Cancer incidence in the Czech Republic 2018. [online]. Available from URL: https: //www.uzis.cz/res/f/008352/novotvary2018.pdf.
3. El-Serag HB. Hepatocellular carcinoma. N Engl J Med 2011; 365(12): 1118–1127. doi: 10.1056/NEJMra1001683.
4. Takayama T, Makuuchi M, Hirohashi S et al. Early hepatocellular carcinoma as an entity with a high rate of surgical cure. Hepatology 1998; 28(5): 1241–1246. doi: 10.1002/hep.510280511.
5. Roayaie S, Blume IN, Thung SN et al. A system of classifying microvascular invasion to predict outcome after resection in patients with hepatocellular carcinoma. Gastroenterology 2009; 137(3): 850–855. doi: 10.1053/j.gastro.2009.06.003.
6. European association for the study of the liver. EASL clinical practice guidelines: management of hepatocellular carcinoma. J Hepatol 2018; 69(1): 182–236. doi: 10.1016/j.jhep.2018.03.019.
7. Heimbach JK, Kulik LM, Finn RS et al. AASLD guidelines for the treatment of hepatocellular carcinoma. Hepatology 2018; 67(1): 358–380. doi: 10.1002/hep.29086.
8. Singal A, Volk ML, Waljee A et al. Meta-analysis: surveillance with ultrasound for early-stage hepatocellular carcinoma in patients with cirrhosis. Aliment Pharmacol Ther 2009; 30(1): 37–47. doi: 10.1111/j.1365-2036.2009.04014.x.
9. Zhang J, Chen G, Zhang P et al. The threshold of alpha-fetoprotein (AFP) for the diagnosis of hepatocellular carcinoma: a systematic review and meta-analysis. PLoS One 2020; 15(2): e0228857. doi: 10.1371/journal.pone.0228857.
10. Baker MJ, Hussain SA, Lovergne L et al. Developing and understanding biofluid vibrational spectroscopy: A critical review. Chem Soc Rev 2016; 45(7): 1803–1818. doi: 10.1039/ c5cs00585j.
11. Tatarkovič M, Fišar Z, Raboch J et al. Can chiroptical spectroscopy be used for the analysis of blood plasma? Chirality 2012; 24(11): 951–955. doi: 10.1002/chir.22063.
12. Synytsya A, Judexová M, Hrubý T et al. Analysis of human blood plasma and hen egg-white by chiroptical spectroscopic methods (ECD, VCD, ROA). Anal Bioanal Chem 2013; 405(16): 5441–5453. doi: 10.1007/s00216-013-6946-6.
13. Tatarkovič M, Synytsya A, Šťovíčková L et al. The minimizing of fluorescence background in Raman optical activity and Raman spectra of human blood plasma. Anal Bioanal Chem 2015; 407(5): 1335–1342. doi: 10.1007/ s00216-014-8358-7.
14. Habartová L, Bunganič B, Tatarkovič M et al. Chiroptical spectroscopy and metabolomics for blood-based sensing of pancreatic cancer. Chirality 2018; 30(5): 581–591. doi: 10.1002/chir.22834.
15. Miskovicova M, Fryba V, Petruzelka L et al. Novel spectroscopic biomarkers are applicable in non-invasive detection and staging classification of colorectal cancer. Neoplasma 2020; 67(6): 1349–1358. doi: 10.4149/neo_ 2020_200506N494.
16. Pence IJ, Patil CA, Lieber CA et al. Discrimination of liver malignancies with 1064 nm dispersive Raman spectroscopy. Biomed Opt Express 2015; 6(8): 2724–2737. doi: 10.1364/ BOE.6.002724.
17. Kirchberger-Tolstik T, Ryabchykov O, Bocklitz T et al. Nondestructive molecular imaging by Raman spectroscopy vs. marker detection by MALDI IMS for an early diagnosis of HCC. Analyst 2021; 146(4): 1239–1252. doi: 10.1039/d0an01555e.
18. Tolstik T, Marquardt C, Beleites C et al. Classification and prediction of HCC tissues by Raman imaging with identification of fatty acids as potential lipid biomarkers. J Cancer Res Clin Oncol 2015; 141(3): 407–418. doi: 10.1007/s00432-014-1818-9.
19. Peng C, Kaščáková S, Chiappini F et al. Discrimination of cirrhotic nodules, dysplastic lesions and hepatocellular carcinoma by their vibrational signature. J Transl Med 2016; 14: 9. doi: 10.1186/s12967-016-0763-6.
20. Zhang X, Thiéfin G, Gobinet C et al. Profiling serologic biomarkers in cirrhotic patients via high-throughput Fourier transform infrared spectroscopy: toward a new diagnostic tool of hepatocellular carcinoma. Transl Res 2013; 162(5): 279–286. doi: 10.1016/j.trsl.2013.07.007.
21. Taleb I, Thiéfin G, Gobinet C et al. Diagnosis of hepatocellular carcinoma in cirrhotic patients: a proof-of-concept study using serum micro-Raman spectroscopy. Analyst 2013; 138(14): 4006–4014. doi: 10.1039/c3an00245d.